

Analytics
Analytics
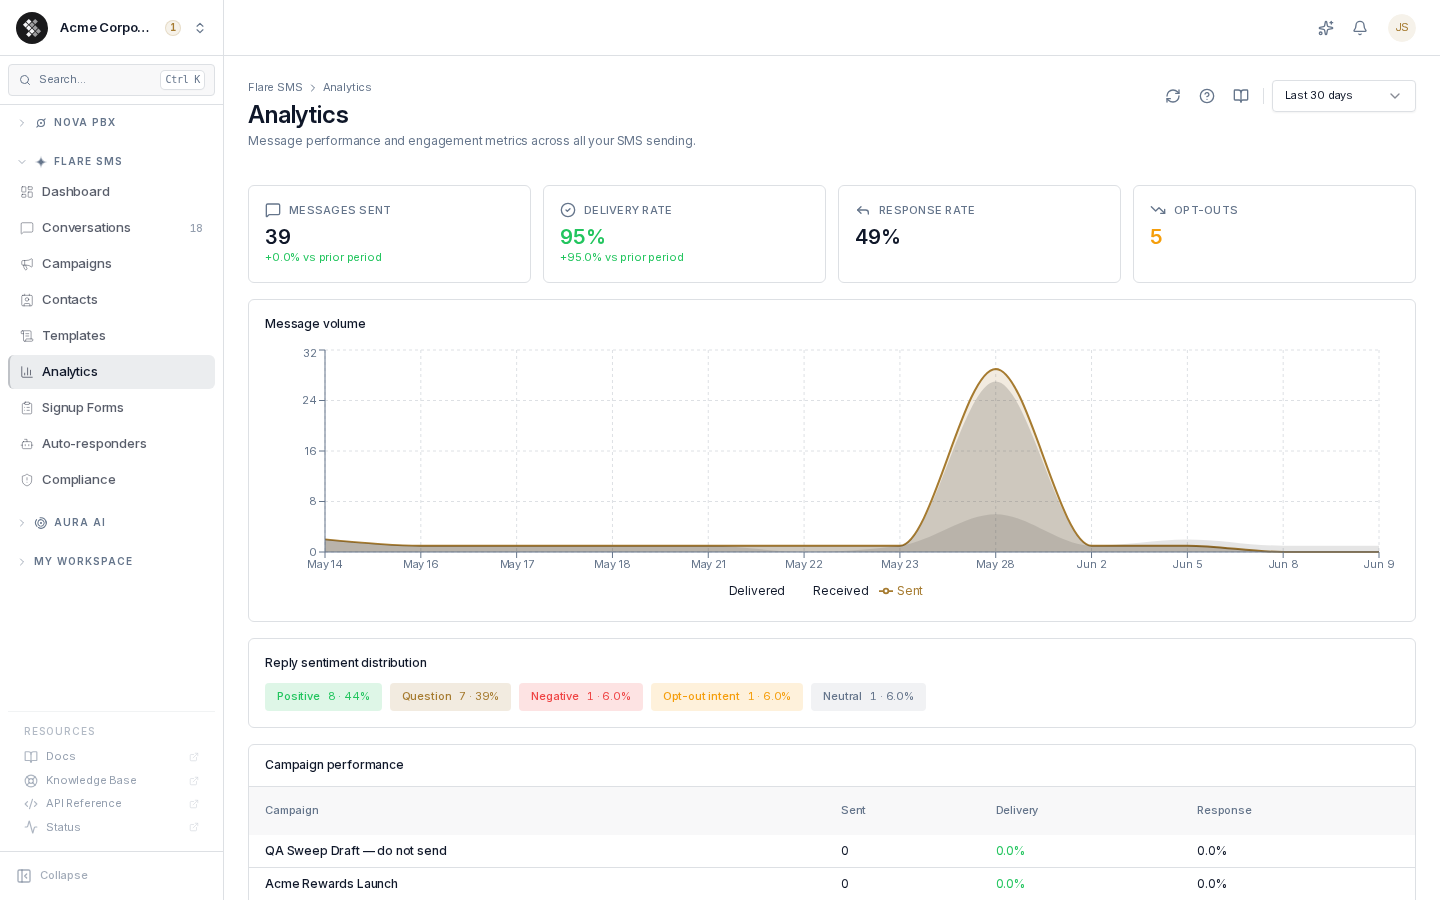
Section titled “Analytics”The Analytics page aggregates SMS performance across all campaigns and conversations in your account for a chosen time window. Navigate to Flare SMS → Analytics.
For a single campaign’s funnel, open that campaign from the Campaigns page instead — its Analytics tab shows the per-campaign breakdown in real time.
Date Ranges
Section titled “Date Ranges”Pick the window from the selector in the header: Last 7 days, Last 30 days, Last 90 days, or Last 6 months. All metrics, charts, and tables update together, and the range is kept in the URL so you can bookmark or share a view.
Metric Definitions
Section titled “Metric Definitions”| Metric | Definition |
|---|---|
| Messages sent | Outbound messages dispatched in the range. The “vs prior period” delta compares against the equal-length period immediately before the window. |
| Delivery rate | Delivered ÷ sent, from carrier delivery receipts. Healthy is 95%+. |
| Response rate | Inbound replies ÷ delivered messages (capped at 100%). A two-way engagement metric — one-way broadcast accounts naturally sit low. |
| Opt-outs | Contacts who opted out (STOP and equivalent keywords) during the range. Highlighted whenever it’s above zero. |
Message Volume
Section titled “Message Volume”The volume chart plots Sent, Delivered, and Received (inbound) counts per bucket. Use it to:
- spot delivery dips (a widening gap between Sent and Delivered suggests list-quality or carrier-filtering problems),
- correlate spikes with campaign launches,
- watch inbound reply volume after a send.
Reply Sentiment Distribution
Section titled “Reply Sentiment Distribution”Inbound replies are auto-classified by a built-in, basic keyword/heuristic signal. It runs automatically on every account — there’s nothing to enable and it doesn’t draw from your Aura credits:
| Sentiment | Meaning |
|---|---|
| Positive | Happy, agreeable, engaged responses |
| Negative | Complaints, frustration |
| Neutral | Short acknowledgments, ambiguous |
| Question | Asking for more information |
| Opt-out intent | STOP-like wording without an explicit keyword — an early-warning signal |
The section is hidden when there are no classified replies in the range.
Campaign Performance
Section titled “Campaign Performance”The table lists campaigns created in the range (top 20) with their sent count, delivery rate, and response rate — a quick way to compare message content and audiences. For the full lifecycle view, use the Campaigns page filters.
Reading the Numbers
Section titled “Reading the Numbers”- Delivery rate dropped this period — check for (1) a new contact list (list quality is the most common cause), (2) a new sending number that hasn’t warmed up with carriers, (3) content changes adding URLs or promotional language that trip carrier filters.
- Opt-outs climbing — review send frequency, audience targeting, and consent quality. Tightening segmentation usually fixes it.
- Response rate looks low — that’s normal for broadcast-style sending; judge it against your own baseline, not a universal benchmark.
- This morning’s campaign isn’t reflected yet — aggregates can lag a few minutes; the campaign detail page is the real-time view. Use the header reload button to refresh.
Compliance Records
Section titled “Compliance Records”Opt-in/opt-out events are logged per contact with timestamps under Flare SMS → Compliance; per-message delivery receipts are stored on each campaign’s Messages tab. This Analytics page is the rolled-up view, not the audit log.