

Wallboard
Wallboard
Section titled “Wallboard”Nova PBX → Call Center → Wallboard is a real-time, large-format display of your call center’s current state — built to be mounted on an office TV or supervisor monitor. It takes over the whole screen (TV-safe margins, follows your light/dark theme) and refreshes itself continuously: what’s queued, who’s available, who’s on a call, and where service level stands right now.
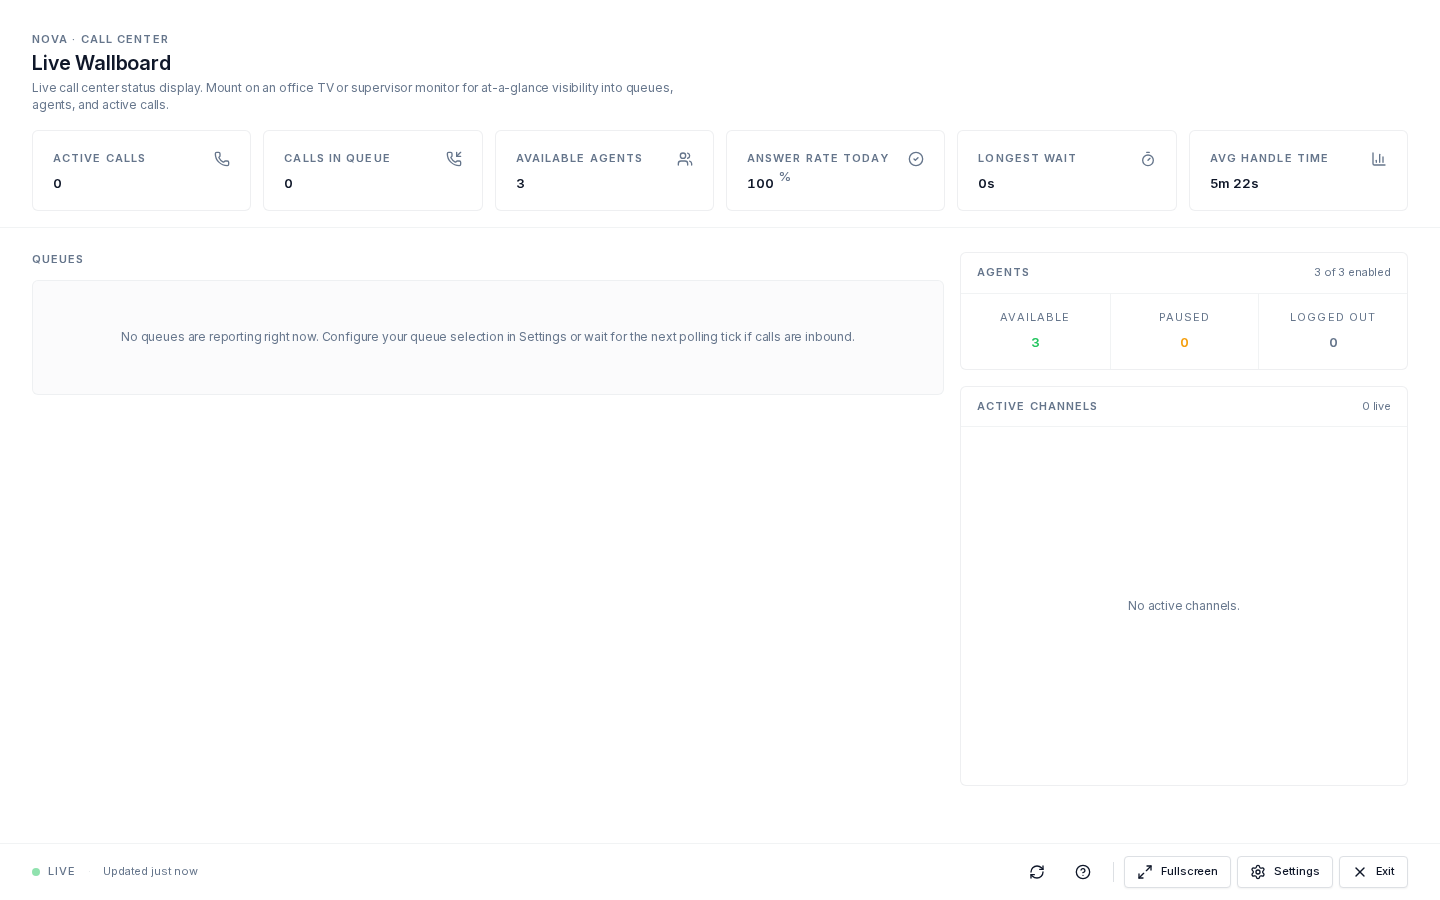
What’s On Screen
Section titled “What’s On Screen”- KPI strip (top) — six headline numbers: Active Calls, Calls in Queue, Available Agents, Answer Rate Today, Longest Wait, and Avg Handle Time. “Today” KPIs roll over at your local midnight. Calls-in-queue turns red when the longest wait crosses your SLA target; answer rate turns red below 80% (once at least one call has come in).
- Queue lanes (left) — one card per reporting queue: callers currently waiting (big number), the longest wait (ticking live), and the agent counts (available / paused / logged in). Lanes turn yellow at 75% of the SLA target and red on breach. Per-queue service levels configured in Queue settings take precedence over the wallboard’s default.
- Agents card (right) — available / paused / logged-out counts across the roster.
- Active channels (right) — every call in progress on your tenant, with caller, extension, state, and duration (capped at 30 rows).
Connection Modes
Section titled “Connection Modes”The pulsing dot in the footer tells you what kind of feed you’re watching:
| Dot | Mode | Behavior |
|---|---|---|
| 🟢 | Live | Sub-second updates over the platform’s real-time event stream — the normal state. |
| 🟡 | Polling | The event stream is unavailable (firewall/proxy); the wallboard falls back to refreshing every 10 seconds (configurable) and recovers to Live automatically. |
| 🔴 | Offline | The platform is unreachable — displayed numbers are stale. |
A queue appears on the board once it has at least one logged-in agent or an active caller; on a system with no live PBX node connected, the queue and channel panels stay empty (with a note) while the historical KPIs still render.
Settings (Per Display)
Section titled “Settings (Per Display)”The Settings gear in the footer configures this browser only — so each TV can have its own view:
- SLA target — the wait-time threshold driving the yellow/red lane colors.
- Refresh interval — polling cadence (minimum 5 seconds) when in polling mode.
- Display name — an optional header label, e.g. “Floor 2 — Sales”.
- Queues — limit the board to selected queues; leave all unchecked to show everything.
Mounting On a TV
Section titled “Mounting On a TV”- Sign in on the TV’s browser with an account that has queue-view permission (users without it see an access notice and a link to Reporting).
- Open the Wallboard, click Fullscreen in the footer.
- Disable the TV/OS screensaver and sleep — the wallboard is designed to run unattended for days.
Press Escape once to leave browser fullscreen, and again to exit the wallboard back to Reporting.
Related Pages
Section titled “Related Pages”| Page | Purpose |
|---|---|
| Reporting | Historical SLA, agent performance, and queue statistics. |
| Queues | Configure the queues the wallboard tracks (including per-queue SLA). |
| Agents | Manage who’s in the agent roster. |