

Call Center Reporting
Call Center Reporting
Section titled “Call Center Reporting”Nova PBX → Call Center → Reporting is the analytics home for your call center: overall call volume, per-queue service-level performance, per-agent productivity, and three deeper reports for shift planning and attendance review. For the current moment on a wall monitor, use the Wallboard instead — Reporting is the historical aggregate, the Wallboard is the live now.
Picking a Period
Section titled “Picking a Period”The Period buttons at the top scope every tab:
| Preset | Chart granularity |
|---|---|
| Today / Yesterday | Hourly |
| 7 days / 30 days | Daily |
Day boundaries and hourly buckets follow your browser’s timezone — “Today” starts at your local midnight, and a 2 pm call charts under 14:00 local time, regardless of where the platform’s servers run.
Live vs. Historical Data
Section titled “Live vs. Historical Data”The page blends two data sources, and they behave differently:
- Historical (stat cards, volume charts, SLA metrics, agent performance, the Reports tab) — built from completed call records and the queue activity log, scoped to the selected period.
- Live (the Waiting column on the Queues tab, the Agent state card on Summary) — reported by your PBX node right now, refreshed automatically every 15–30 seconds. Live data ignores the period filter.
If your PBX node is unreachable, live sections simply show no waiting counts and the historical sections keep working — nothing errors out.
Summary Tab
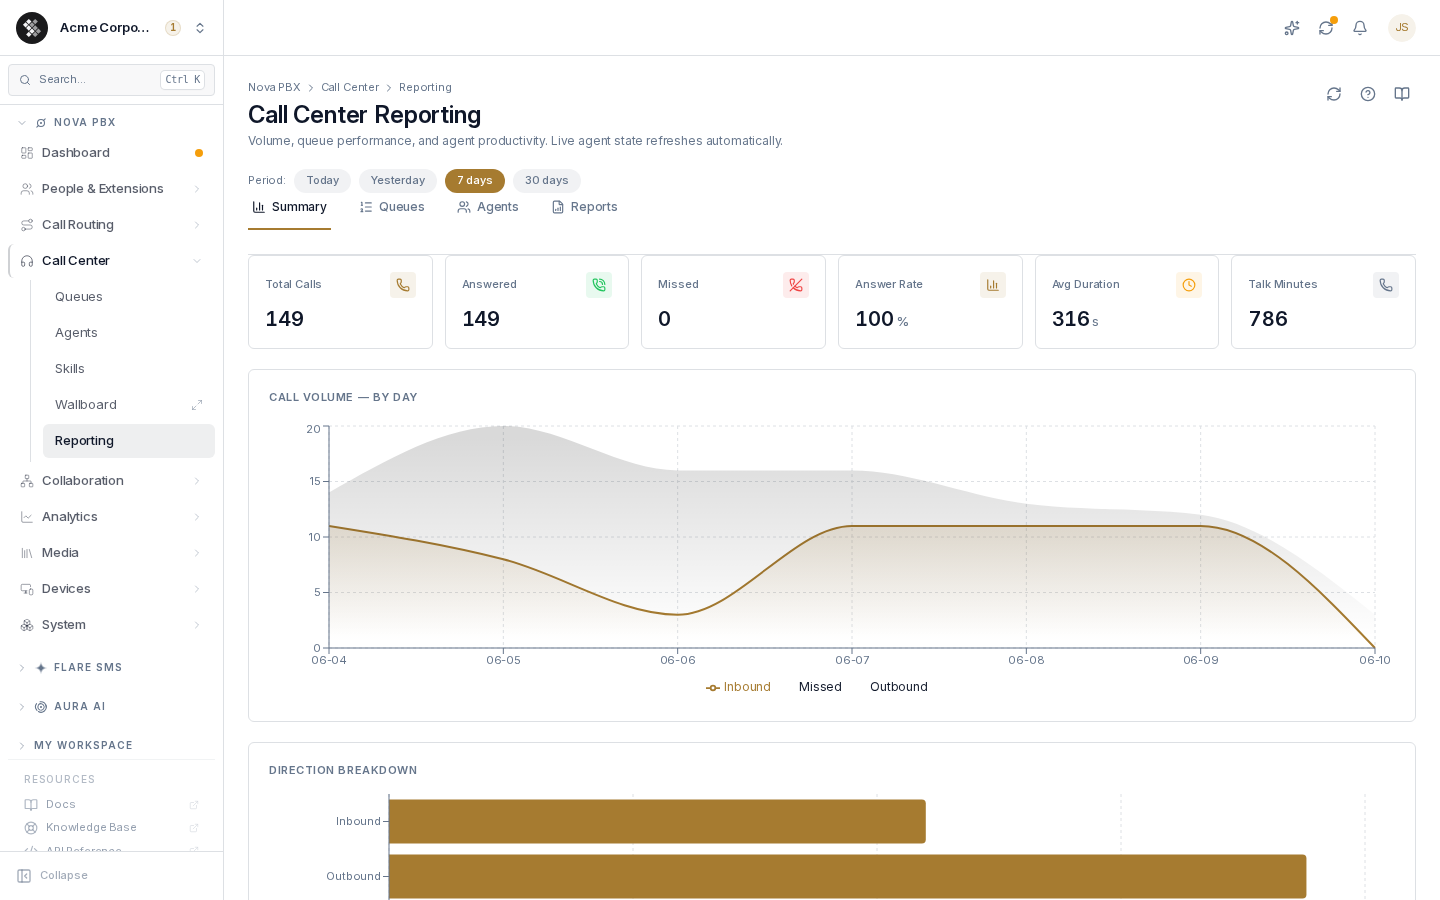
Section titled “Summary Tab”Six period-scoped stat cards, exactly as computed:
| Metric | Definition |
|---|---|
| Total Calls | Every call placed or received in the period, all directions. |
| Answered | Calls that connected and accumulated talk time (any direction). |
| Missed | Calls that never connected — zero talk time, any direction. |
| Answer Rate | Answered ÷ Total Calls, as a percentage. |
| Avg Duration | Mean talk time in seconds, across answered calls. |
| Talk Minutes | Total minutes of talk time in the period. |
Below the cards: a call volume area chart (hourly or daily, by direction), a direction breakdown bar, and the live agent state card (Total / Available / Paused / Logged Out).
Queues Tab
Section titled “Queues Tab”- Queue overview — every configured queue with its ring strategy, live waiting count, member roster (active / paused / total), and status. Click a row to open that queue’s editor.
- Queue SLA metrics — per-queue performance for the period, from the queue activity log:
- Abandon Rate — abandoned ÷ total queue entries (flagged red above 10%).
- Avg Wait / Avg Talk — mean hold time before connect, and mean talk time.
- SLA % — the share of answered calls picked up within the service-level threshold (60 seconds by default). Green ≥ 90%, yellow 70–90%, red below.
Queues with zero calls in the period don’t appear in the SLA table — switch to 30 days to see all active queues.
Agents Tab
Section titled “Agents Tab”Per-agent productivity for the period: Calls Taken, Avg Handle (talk + after-call wrap-up), Avg Talk, Ring No Answer (the agent’s phone rang but they didn’t pick up), and Total Talk. Use it to spot uneven call distribution and coaching opportunities.
Reports Tab
Section titled “Reports Tab”Three deeper reports, each scoped by the period plus a cross-cutting filter rail (by queue or by agent, depending on the report):
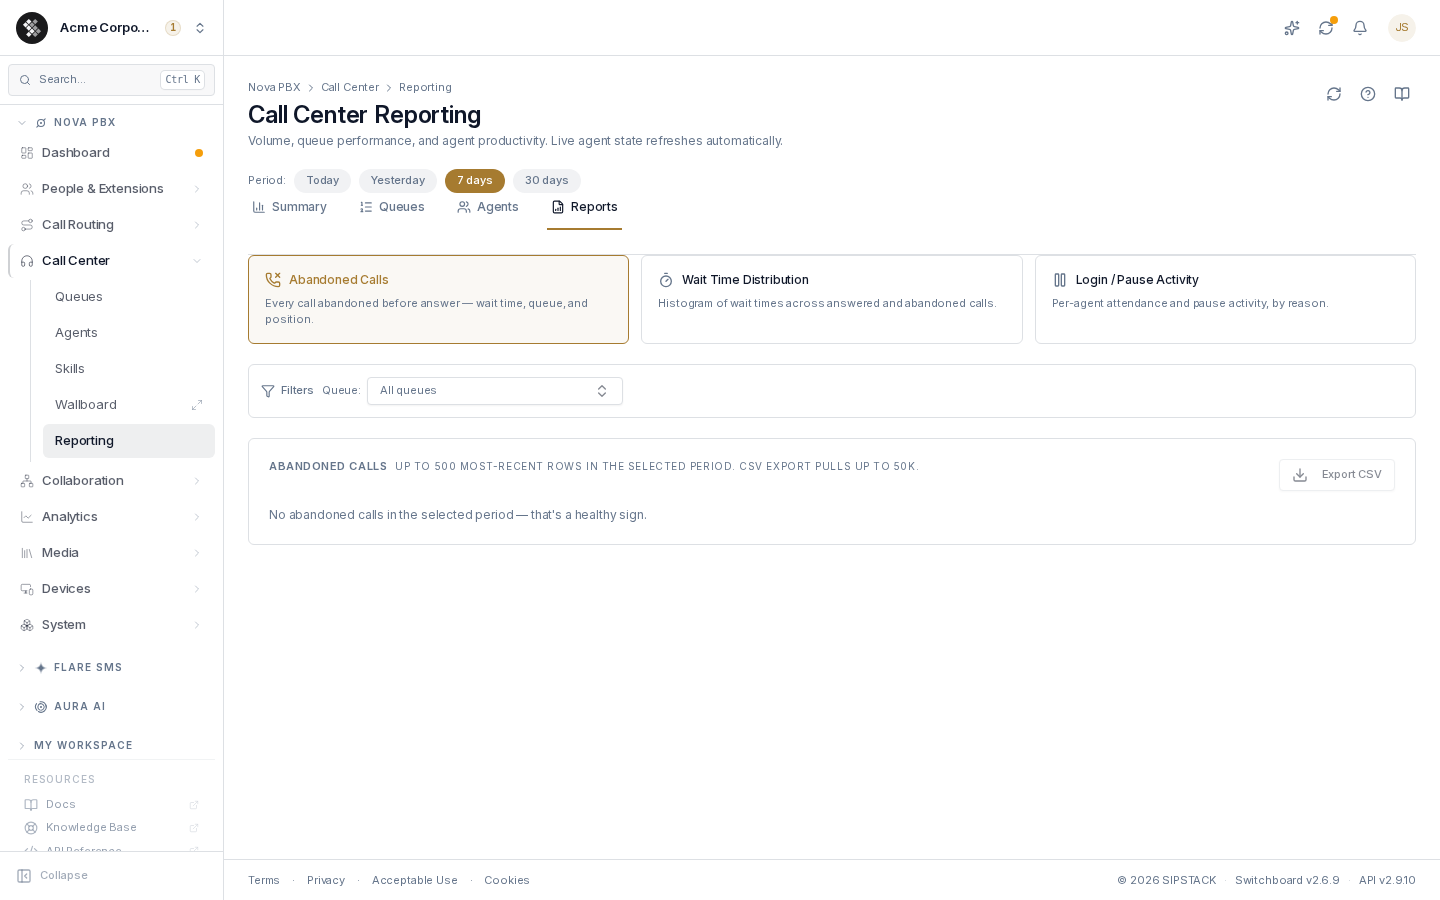
- Abandoned Calls — every caller who hung up before being answered: when, which queue, how long they waited, and the queue position they reached. Up to 500 most-recent rows on screen.
- Wait Time Distribution — a histogram of wait times (0–10s through 10+ min), split into answered vs. abandoned. The bucket where abandons spike is your callers’ patience limit.
- Login / Pause Activity — per-agent attendance: login/logout counts, pause counts, total paused time, and the top pause reasons.
Each report has an Export CSV button that honors the active filters and period (up to 50,000 rows per export).
Related Pages
Section titled “Related Pages”| Page | Purpose |
|---|---|
| Wallboard | Fullscreen live queue status for a wall monitor. |
| Queues | Configure the queues these reports measure. |
| Agents | Manage the agent roster and availability. |
| Call History | Per-call drill-down — Reporting is the aggregate view. |