

Call Insights
Call Insights
Section titled “Call Insights”Nova PBX → Analytics → Call Insights answers two questions that the row-by-row Call History can’t: when do your customers call, and what are they calling about. Call History is the ledger; this page is the pattern.
What you get on which plan
Section titled “What you get on which plan”The page has two halves, and they are gated differently.
| Half | What’s in it | Requires |
|---|---|---|
| Call volume | Peak window, busiest day, weekday-vs-weekend, the day × hour heatmap, volume over time | Any Nova plan — no setup, no extra cost |
| AI analysis | Conversation themes, sentiment, call recordings, transcript search, record-all | Nova Ultra |
On a plan below Ultra the AI half still renders, blurred, behind an Unlock Aura AI Call Insights panel — so you can see the shape of what you’d get before you buy. The upgrade button opens your subscription with the unlocking plan preselected. (Record all calls is not part of that preview; it appears once you’re on Ultra.)
Conversation themes and sentiment are built from calls Aura processed automatically — keep Auto-process recordings with Aura AI on under Recording Settings. Calls you only transcribe on demand from Call History don’t feed them.
Three panels carry an extra permission check on top of the plan, and are hidden — not shown locked — for users without it:
- Call recordings and Search call transcripts need View All Call History (
nova.cdr.view_all). - Record all calls needs Delete Recordings (
nova.recordings.delete) — the aggregate “manage recordings & media” grant, despite the narrow name.
Account owners have all of these implicitly.
Choosing a time range
Section titled “Choosing a time range”The controls above the first card set the window:
- Calendar periods — Today, Yesterday, This month.
- Rolling windows — 7d, 30d, 90d. The page opens on 30d.
The call-volume half uses the exact calendar dates you pick. The AI panels work in whole days counted back from today instead, so a calendar period there means “the same number of days, ending today” — Yesterday shows the same AI numbers as Today. Three panels don’t follow the picker exactly:
- Conversation themes are precomputed for 7, 30 and 90 days; any other range shows the nearest of those.
- Search call transcripts always searches every processed call, whatever the range.
- The Record all calls spend projection is always based on the last 30 days.
The three callouts
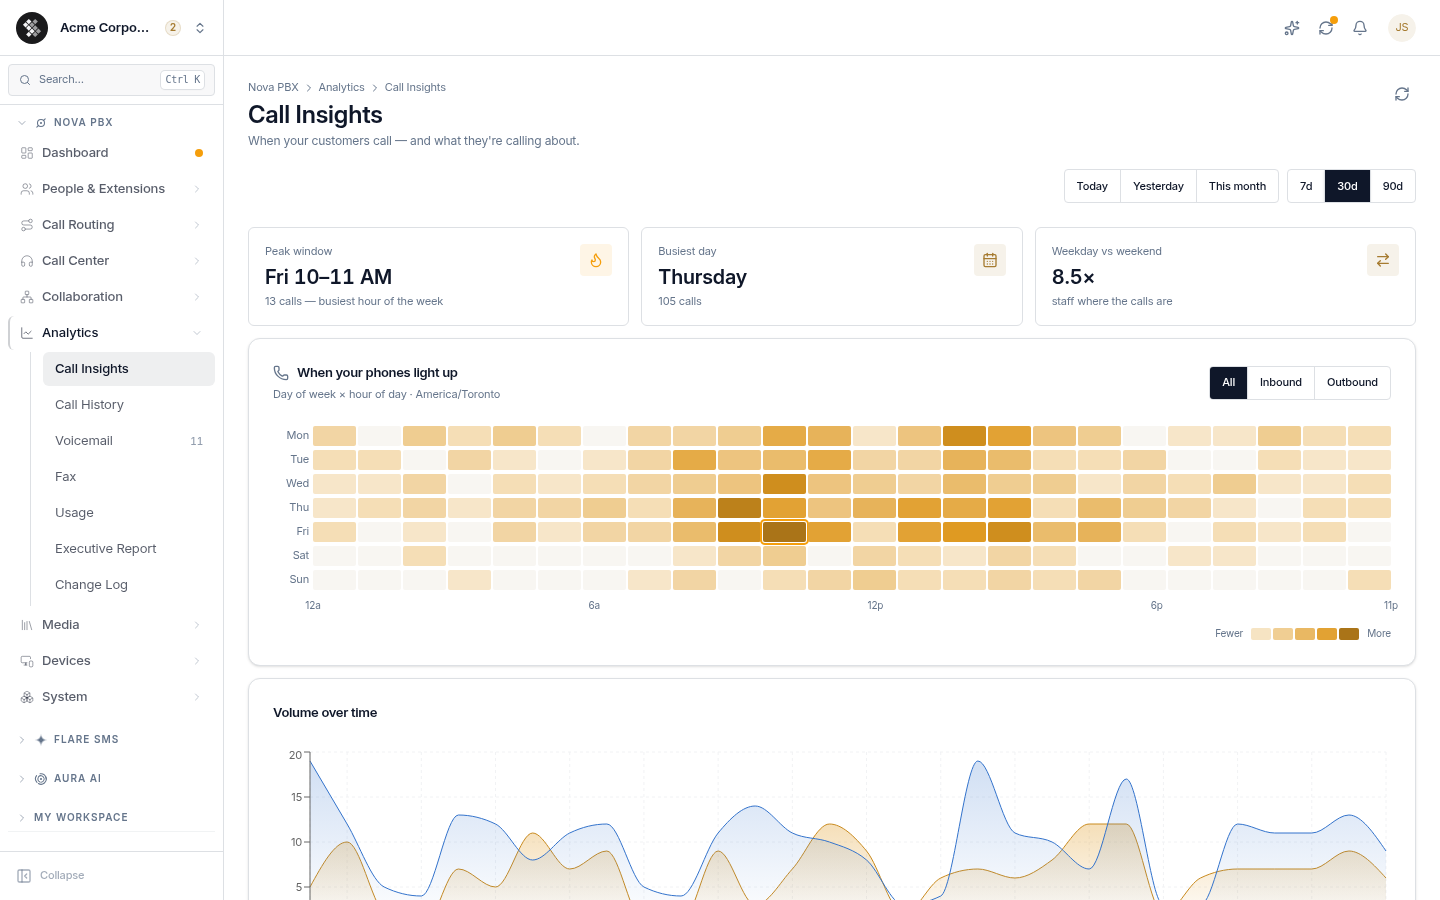
Section titled “The three callouts”- Peak window — the single busiest hour of the week, e.g. “Fri 10–11 AM”, with the call count behind it. This is the hour to have your best people on the phones.
- Busiest day — the day of the week carrying the most calls across the range.
- Weekday vs weekend — all Monday–Friday calls divided by all Saturday–Sunday calls in the range. Over whole weeks, five weekdays against two weekend days makes 2.5× an even spread per day: well above it, weekend cover is optional; below it, weekends are busier per day than weekdays. It shows ”—” when there were no weekend calls to compare against.
When your phones light up
Section titled “When your phones light up”The heatmap is a grid: days of the week down the side, the 24 hours of the day across. The stronger a square’s colour, the more calls landed in that hour, and the busiest cell of the whole week is ringed. It counts external calls only — internal extension-to-extension calls are left out — so its totals won’t match Call History.
Two things worth knowing:
- It buckets in your organization’s timezone — the Timezone on Account Settings → Company, printed under the card title (e.g.
America/Toronto), or UTC if none is set. It is not the viewer’s browser timezone, so everyone on your team reads the same grid. - The All / Inbound / Outbound toggle re-cuts the whole card, including the three callouts above it and the volume chart below it. Inbound is the view that matters for staffing: it’s the calls arriving that someone has to answer. Outbound shows what your own team is dialling.
Hover any square for the exact day, hour, and call count.
Volume over time
Section titled “Volume over time”The same window plotted day by day, inbound and outbound as separate bands. Use it to spot the things a weekly average hides: the spike after a campaign went out, the Tuesday your main number was misrouted and the line went flat.
Conversation themes
Section titled “Conversation themes”Themes are discovered, not configured. Aura clusters your recorded calls by what was actually said and names each cluster — “Unrecognized Charge”, “Appointment Scheduling”, “Device Reboot Issue”. Nobody tags a call, nobody picks a wrap-up code, and the list re-derives itself from whatever your customers are calling about this month.
Each row shows:
- Rank and share — the percentage of analyzed calls in that theme, and the raw call count.
- A sentiment bar — the positive / neutral / negative mix within that theme. A theme can be large and healthy, or small and entirely negative; the bar is where you see the difference.
- A trend chip — whether the theme is climbing or falling: its call count in the second half of the window compared with the first half. No chip means no change, or nothing to compare against.
The card is stamped with the date it was last computed. Press Refresh to recompute the themes from your recent calls. The recompute runs in the background, so the panel doesn’t change straight away — reload the page shortly to pick up the result. Themes computed within the last ten minutes are already current, and Refresh leaves them as they are.
Sentiment
Section titled “Sentiment”Three numbers and a chart, across the calls that were analyzed in your window:
- Positive — the share of sentiment-scored calls that came out positive.
- Calls analyzed — how many processed calls sit behind the panel. Read this before you react to the percentage.
- Minutes — how much conversation that covered.
The bar chart underneath is the full positive / neutral / negative split.
Call recordings
Section titled “Call recordings”Up to the 25 most recent recorded calls and external conferences in the window, newest first, filterable by All / Calls / Conferences. Each row carries when it happened, the parties, duration, the sentiment label, the intent Aura detected (billing, booking, support, complaint…), and a one-line summary.
The summary is the point: you can triage a month of calls by reading, without pressing play on any of them.
Search call transcripts
Section titled “Search call transcripts”This searches by meaning, not keywords. Ask for “a charge the customer didn’t recognize” and you get the billing calls where someone queried an invoice line — including the ones that never used the word “charge”.
Each hit shows the parties, a match score, and a snippet. Click one to open the full call detail, with the recording and transcript.
Record all calls
Section titled “Record all calls”The switch that turns on recording of external calls — inbound and outbound — for every extension at once, rather than only the extensions you’ve individually set to record. While it is on, new extensions are created with recording already on. Recording is only the capture half: the calls are transcribed and analyzed automatically only while Auto-process recordings with Aura AI is on in Recording Settings.
Before you turn it on, the card shows the projected monthly transcription spend — a dollar figure, the credits and minutes behind it, and the number of calls over the last 30 days it was extrapolated from. Turning it on opens a confirmation that repeats the projected spend and asks you to confirm your call-recording disclosure is in place — two-party-consent states require notifying everyone on the call.
Related
Section titled “Related”- Call History (CDRs) — the row-by-row record of individual calls.
- Recording Settings — the disclosure announcement, Aura AI auto-processing, and speaker diarization.
- Adding & Editing Extensions → Recording — turn recording on or off for an individual extension.
- Usage — minutes, messages, and what they cost.