

Dashboard
Dashboard
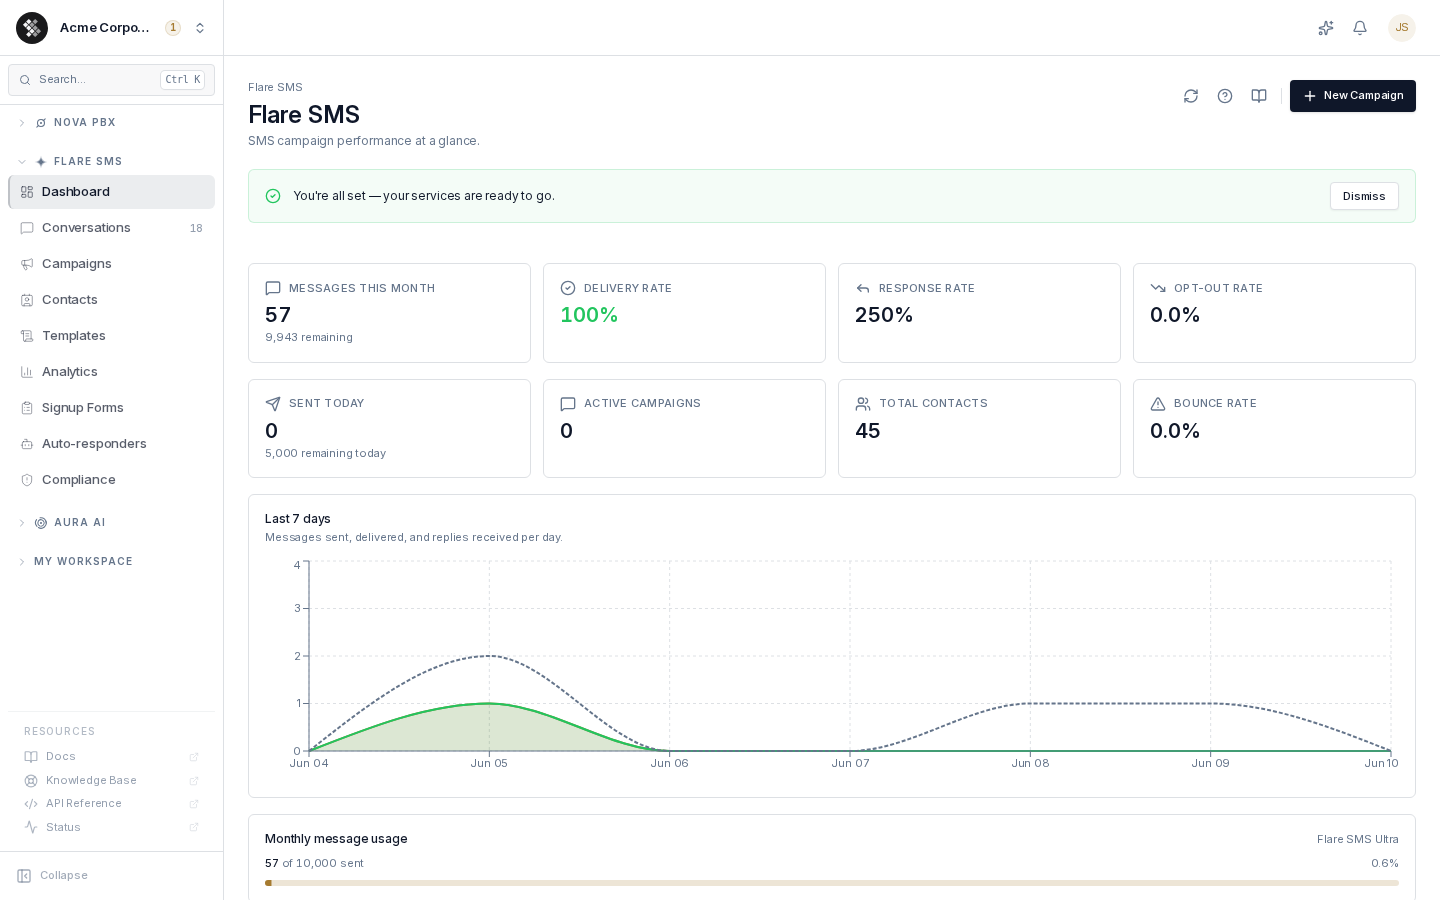
Section titled “Dashboard”The Flare dashboard is the at-a-glance health view of your SMS program. Navigate to Flare SMS → Dashboard (it is also the landing page when you open Flare SMS).
Reading the Metrics
Section titled “Reading the Metrics”The top row covers your current pool period (from your billing date):
| Metric | What it tells you |
|---|---|
| Sent this period | Segments your team inbox numbers sent in the current pool period, which starts on your billing date, against your plan’s monthly allowance. |
| Delivery rate | Percentage of outbound messages confirmed delivered. Healthy is 95%+; below 90% usually means stale or invalid numbers in your list, or carrier filtering. |
| Response rate | Percentage of delivered messages that received a reply — most meaningful for two-way and conversational use. |
| Opt-out rate | Percentage of recipients who replied STOP. Flagged yellow above 2% — review message frequency, relevance, and consent collection. |
The second row covers totals and quality:
| Metric | What it tells you |
|---|---|
| Sent today | Segments your team inbox numbers sent today, shown as N / limit with Daily send limit · resets 00:00 UTC. During a trial it shows just the count. |
| Active campaigns | Campaigns currently sending or scheduled. |
| Total contacts | Recipients in your contact list. |
| Bounce rate | Percentage of messages that failed at the carrier. Flagged yellow above 5% — clean your list before sending more. |
Checking Recent Activity
Section titled “Checking Recent Activity”The Last 7 days chart plots daily message activity, oldest to newest:
- Sent — outbound messages per day
- Delivered — carrier-confirmed deliveries per day
- Replies — inbound responses per day (dashed line)
Days with no traffic show as zero. Use the chart to spot a sudden delivery dip (possible carrier filtering) or a reply spike (staff the inbox). For longer ranges and per-campaign funnels, use Flare SMS → Analytics.
Tracking Plan Usage
Section titled “Tracking Plan Usage”If your subscription has a monthly message allowance, a Monthly message usage bar shows consumption against it for your current pool period (which starts on your billing date). The line under the bar, Received: N of M segments included, tracks your separate inbound allowance. The bar turns yellow at 80% and red at 95%. Going past the allowance doesn’t stop sending on an active, paid plan with a valid payment method — the extra segments bill at your tier’s overage rate. During a trial, or without a valid payment method, outbound sending stops at the allowance. If you’ve added a prepaid SMS balance, overage segments are paid from it first; whatever it doesn’t cover is billed on your invoice, and an empty balance never stops sending. See SMS Usage, Limits & Billing.
These figures count your shared team inbox numbers only. Personal Nova numbers use your Nova plan’s allowance and appear on Nova PBX → Analytics → Usage.
To review or change your plan, see the Subscriptions page in your account settings.
Acting on a Problem
Section titled “Acting on a Problem”- Delivery rate dropped — open Analytics to find which day/campaign drove the drop, then check the campaign’s content (too many links, spam-trigger wording) and list quality.
- Opt-out rate above 2% — reduce frequency, tighten segmentation with tags, and confirm recipients actually opted in.
- Approaching the monthly allowance — reduce planned sends or upgrade before campaigns push you into overage. Campaign messages that reach the daily send limit or the monthly safety ceiling are held and retried automatically (details).
Refreshing the Data
Section titled “Refreshing the Data”Use the reload button in the page header to refresh on demand. Otherwise the dashboard serves cached numbers for about a minute and refetches when you return to the tab.
Related Pages
Section titled “Related Pages”- Conversations — the two-way SMS inbox
- Contacts — manage recipients, tags, and opt-outs
- Campaigns — bulk and drip sending
- Analytics — date-range and per-campaign reporting